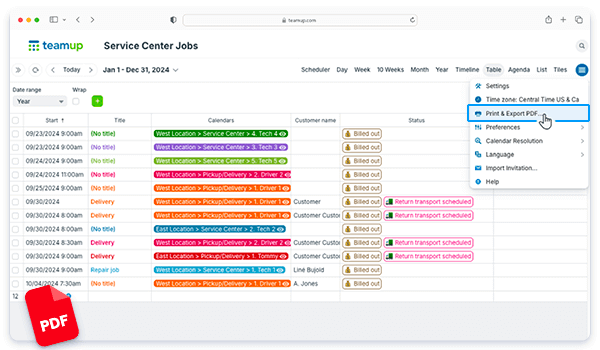
Table view gives you the ability to work with time-based information (i.e. events and tasks on a calendar) easily in a spreadsheet-like view.
Instead of dragging data from spreadsheet to calendar, you can see info in a calendar grid, then 🖱click! it’s in a sortable table. You’ll be able to work with data in a way calendars don’t usually allow: view and sort calendar fields in columns, plus let your calendar calculate for you. And you can generate a PDF from your filtered view. It’s an easy way to create and share reports quickly.
Here’s how to do it:
- First, make sure you’re capturing the data you need in your report. Configure and add custom fields to easily collect and organize all the details.
- When you’re ready to generate a report, switch to Table view.
- Adjust the date range so you’re viewing the relevant dates.
- Hide the columns you don’t need. You can also rearrange visible columns.
- Toggle sub-calendars and use filters so only the events you want to include are shown on the screen.
- When everything is set up the way you want, click the blue menu (top right), then click PDF Print & Export.
- Adjust the options as needed (e.g. hide the sidebar, make sure the page layout is correct) then download or print the report. Note: If you need to adjust the scale more, use your browser’s print option; scale as needed, then save as a PDF or print.
ℹ️ Learn more


